Deploying and Monitoring Large Language Models (LLMs) with ProActive AI Orchestration and MLOps Dashboard
Industrialize LLMs at Scale with ProActive
7 min
Jul 18, 2023 from Activeeon
Large language models (LLMs) have emerged as powerful tools that can comprehend and generate human-like text. These models, such as OpenAI’s ChatGPT, have opened up new possibilities in natural language processing, enabling applications like chatbots, text generation, and language translation to reach remarkable levels of sophistication.
However, taking advantage of the full potential of LLMs requires more than just building the models themselves. The deployment and monitoring of these complex AI systems present unique challenges. Deploying LLMs involves integrating them into real-world applications and ensuring their seamless operation. It requires addressing concerns such as infrastructure requirements, resource management, and scalability. Additionally, monitoring LLMs is crucial to ensure their performance, and maintain data privacy and security, that’s where ProActive AI Orchestration and its MLOps Dashboard come into play.
Learn more about MLOps benefits
ProActive AI Orchestration offers a comprehensive solution for deploying and managing LLMs at scale. This powerful platform provides an environment that streamlines the deployment process, automates resource allocation, and optimizes the utilization of computational resources. With ProActive AI Orchestration, organizations can efficiently deploy LLMs in production environments and leverage their capabilities to drive innovation and enhance customer experiences.
The MLOps Dashboard, an integral component of ProActive AI Orchestration, allows both small and large companies to monitor and manage LLMs effectively. It provides a centralized interface for tracking performance metrics, visualizing resource utilization, and detecting potential issues in real-time. Furthermore, it includes features specifically designed to manage and monitor the underlying model servers.
In this blog, we will explore how to deploy and monitor LLMs using ProActive AI Orchestration and its MLOps Dashboard. We will explore best practices, discuss real-world use cases, and highlight the benefits of adopting this powerful solution. Whether you are a data scientist, a software engineer, or an AI enthusiast, this blog will provide you with practical insights to release the full potential of LLMs in your AI applications.
1. How to fetch and deploy LLMs from Hugging Face models
Hugging Face plays an important role as a key enabler for Generative AI use cases, offering pre-trained Large Language Models (LLMs) in a diverse range of applications. For our blog, we use the pre-trained model GPT-2 from Hugging Face. GPT-2 is a transformer-based language model that has been trained on a massive amount of English text data. It was specifically trained to predict the next word in a sentence given the preceding context [1]. We integrate the code for downloading the GPT-2 model from Hugging Face into our ProActive Workflows Studio. It is specifically designed for creating robust and scalable workflows. With its intuitive visual interface, users can effortlessly design complex workflows by simply dragging and dropping predefined components onto a canvas and connecting them together. By leveraging this powerful tool, you can streamline the development process and create robust workflows that are ready for deployment in a production environment.
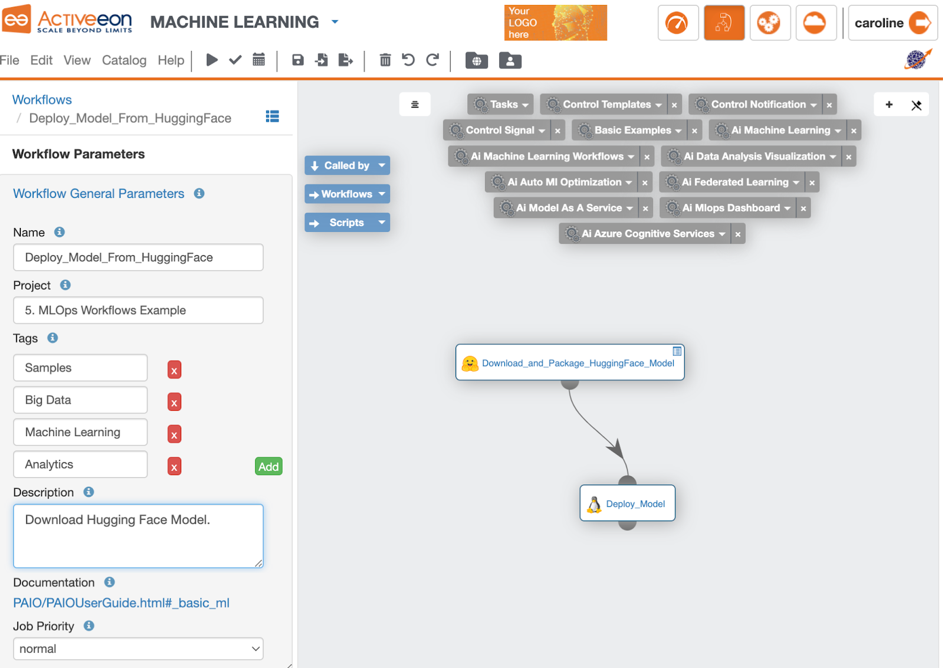
Figure 1. Model deployment from Hugging Face using the ProActive Workflows Studio.
Figure 2. Launching GPT-2 model deployment using ProActive Workflows Studio.
2. Monitor the deployed model on the MLOps Dashboard
We are now monitoring the GPT-2 model using the MLOps dashboard. It provides three distinct tabs - Model Servers Monitoring, Models Resource Usage, and Dashboard Resource Usage.
2.1. Model Servers Monitoring
The “Model Servers Monitoring” tab focuses on overseeing the health and performance of the model servers or serving infrastructure. It consists of two main components: widgets and a table listing the model servers and their characteristics.
Figure 3. Model Servers and Models Monitoring.
The first component of the tab includes six main widgets that offer valuable insights into the overall performance and usage of the serving infrastructure. These widgets cover aspects such as the number of running model servers, GPUs utilization, deployed models count, inference times, and inference rates. The second component of the tab features a detailed table that lists the model servers along with their specific characteristics. This table provides comprehensive information about each model server instance, including its ID, status, start time, node information, GPU allocation, model registry location, and more.
2.2. Models Resource Usage
The “Models Resource Usage” tab in the MLOps monitoring dashboard provides users with valuable insights into CPU and GPU resource utilization, enabling them to make decisions and optimize their system’s resource consumption.
Figure 4. Model Resource Usage.
Request a demo
The first part of the tab features ten widgets that offer real-time metrics, such as average CPU and GPU utilization, memory consumption, and available memory. These widgets provide users with a comprehensive overview of resource usage, empowering them to monitor performance trends, identify bottlenecks, and optimize resource allocation effectively. The second part of the tab presents graphs that provide detailed time series data for each model server, focusing on CPU and GPU utilization, memory usage, and power consumption.
2.3. Dashboard Resource Usage
The “Dashboard Resource Usage” tab in the monitoring dashboard provides users with valuable insights into the resource consumption of the entire system. This tab offers a comprehensive overview of CPU utilization, memory consumption, disk memory usage, and network traffic, enabling users to effectively monitor and optimize resource allocation.
Figure 5. Dashboard Resource Usage.
The first part of the tab focuses on providing key metrics that reflect the overall system resource consumption. These metrics include CPU utilization, memory consumption, total available memory, used memory, and free memory. By monitoring these metrics, users can assess the workload of the system, ensure sufficient memory resources are available, and identify any performance issues or bottlenecks. The second part of the “Dashboard Resource Usage” tab features time series graphs that provide deeper insights into CPU utilization, memory usage, disk memory, and network traffic. These graphs offer a visual representation of the system’s resource consumption over time, facilitating trend analysis and identification of potential anomalies.
Once deployed, the GPT-2 model becomes accessible via REST APIs for consumption by any program or web application. This flexibility enables users to seamlessly integrate the model into their existing systems and leverage its power for various tasks and use cases. This integration allows users to leverage the power of their deployed machine learning models and make real-time predictions.
In this blog, we demonstrate the consumption of the GPT-2 model by a Streamlit app developed by us [3]. This app was developed with the purpose of demonstrating how to consume the GPT-2 model deployed in production. The app also serves as a template or example of how to build a client that can consume any LLM deployed on the MLOps Dashboard.
When consuming the model, there are two mandatory parameters that the application must consider: the Inference Endpoint and the Model Name. These parameters are crucial for establishing the connection and accessing the deployed model. The Inference Endpoint specifies the URL or endpoint where the model is hosted, while the Model Name identifies the specific model to be used for generating predictions.
Figure 6. Real-time GPT-2 predictions using Streamlit app.
The Streamlit app provides a user-friendly interface where users can input data and obtain predictions generated by the deployed GPT-2 model. With its intuitive design and seamless integration, the app enables users to interact with the model effortlessly, making it accessible to both technical and non-technical individuals.
Through the Streamlit app, users can conveniently enter their desired data, whether it’s text, numerical values, or any other relevant information. The app then leverages the deployed GPT-2 model to process this input and generate insightful predictions. These predictions can cover a wide range of tasks, such as text generation, sentiment analysis, language translation, and more, depending on the specific capabilities of the GPT-2 model that has been deployed.
In summary, the Streamlit app simplifies the interaction with the model, enabling users to input data effortlessly and obtain accurate predictions in a user-friendly manner. With its intuitive interface, real-time feedback, and customization options, the app empowers users to unlock the full potential of the deployed GPT-2 model for a wide range of tasks and applications.
For more information and detailed guidance, please refer to ProActive AI Orchestration documentation or contact us.
contact us
See also: Machine Learning Operations (MLOps)
4. References
- Hugging Face - GPT-2 Model: [https://huggingface.co/gpt2?text=Artificial+Intelligence+%28AI%29+is+a+set]
- Streamlit: [https://streamlit.io/]
- Streamlit GPT2 client app [https://github.com/ow2-proactive/mlops_streamlit_gpt2_app]